
Main / GroupONe
- i would like to see critical analysis and conclusions (are the result in agreement with theoretical expectations? what are potential errors? what are pros and cons of the different methods applied?) rs.
- Infact the results obtained which are in agreement with the one available in Radio Handbook. (Lenght vs. losses)
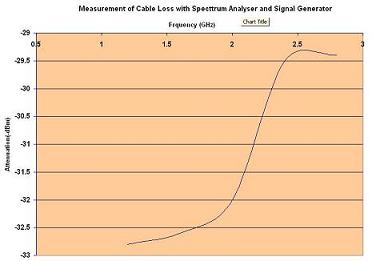
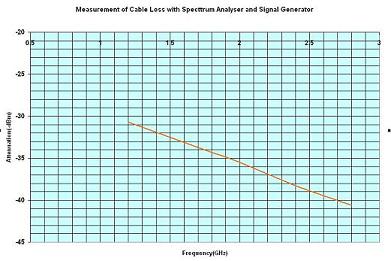
- The losses at different frequncies can be known, for different cables, if we plot a graph for frequncies and signal strength.
- graphs are seen below.
Group Name : "Spectrum2006"
Group Members
- 1. Guadamuz Brenes Saul Armando
- 2. Kotamraju Sarat Kumar
- 3. Manandhar Prashant
- 4. Munyandekwe Martin
- 5. Nkurikiyimfura Didier Kagabire
- 6. Nyondo Velton Mboya Lighton Andrew
- 7. Ragu Kumar Siruvanoor Narayanaswamy
- 8. Vyas Om Prakash
DATE : 07-02-2006 Evening Session

Name of the Experiment :
Measurement of Cable Loss with Specttrum Analyser and Signal Generator.
Objective of the Experment
We want to use a spectrum analyser to measure a signal produced by a signal generator to measure the loss of a cable at different frequencies (called frequency response of the cable)
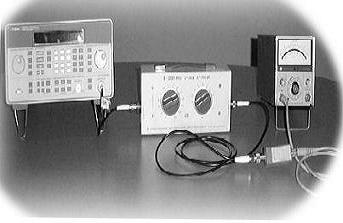
Equipment Required:
- A signal Generator
- A Spectrum Analyser
- the cable under measurement
- an interconnection cable
- connector/gender adapters if required
*Procedure:
Before starting the experiement, we were cautious not to overload the spectrum analyser which lead to damage or injury. We estimated the power we are going to apply to the device before connecting it ( -20 dBm)
- Type of cable B
- Test Cable length 102.5 cm
- Connector type Female/male SMA
- adaptor BNC
- Reference cable length : 192 cm
Connections Were made as per the procedure by taking all the precautions into consideration.
After swithcing on the Agilent Signal generator 8684C (9KHz-3200 MHz?) the preliminary settings are done.(of course waited enough for proper heat up)
FREQUENCY is varied in steps of 400 MHz? Starting from 1.2 to 2.8 GHz? (Plz note here different frequencies are considered)
The modulation and the power level is fixed as a reference in signal generator.
- We have taken the ref cable named as No 11.
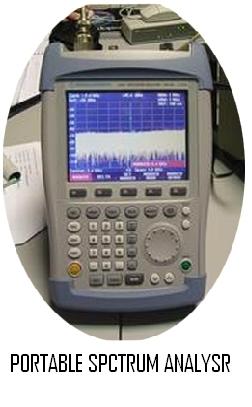
- For all the frequencies the siganl strength vs frequncy is observed on the Portable Spectrum Analyser FSH3? SA 100Khz -3GHz).
As per the infroamtion available from Radio Lab Handbook of ICTP, the loss for the length is dB/100m.
For 1m ,approxmately we have obtained -1dbm
In the spectrum analyser we obtained the values of the RF O/p for different frequencies.
Center Frequency = Variable (for different Frequncies)
For all the frequncies, signal level was noted in the tabular format.
Now the Cable B is connected to know the effect and calculate losses because of the cable in between the signal generator & spectrum analyser the same procedure is repeated in steps.
OBSERVATIONS:
We obtain the valuse whcih are about the value of -1dBm for about 1 mt length.
THE SAME PROCEDURE IS REPEATED FOR FIVE DIFFERENT TYPES OF CABLES INSERTED IN BETWEEN SIGNAL GENERATOR AND SPECTRUM ANLYSER, TO KNOW THE LOSSES BECAUSE OIF THAT.
RESULTS: DEPENDING ON THE LENGTH OF THE CABLE THE LOSS ARE VARAIABLE , AND THEY ARE OBSERVED MORE WHEN THE LENGTH IS MORE,
LOSSES INCRESES WITH RESPECT TO THE LENGHT OF THE CABLE. THEREFORE IT IS BETTER TO USE SMALL LENGTH OF THE CABLE FOR ACCURATE MEASURENETS IF NOT WE HAVE TO USE THE GOOD QUALITY CABLE FOR LONGER LENTHS TO COME OUT FROMN THIS LOSSES.
WHEREEVER IT MAY BE WE NEED GET LESS LOSSES AT THE OUTPUT. This is the major requirement.
| CABLE NAME | LENGTH (cm) | TYPE |
|---|---|---|
| A | 103.5 | RG214?/4 |
| B | 102.5 | RG 59 B/N |
| C | 3480 | XT 213 SN Coaxial |
| D | 1930 | RG 58 50 Ohm |
| E | 330 | |
| F | 390 |
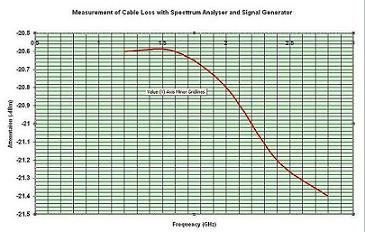
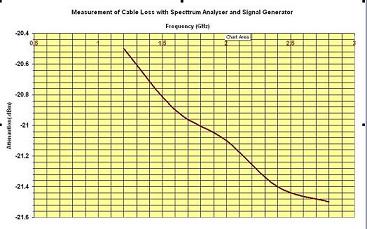
| Freq(GHz?) | Ref | A | B | C | D | E | F |
|---|---|---|---|---|---|---|---|
| 1.2 | -20.6 | -20.5 | -31.8 | -30.7 | -35.7 | -22.7 | -23.3 |
| 1.6 | -20.6 | -20.9 | -32.6 | -33.1 | -39.2- | 23.3 | -24.7 |
| 2.0 | -20.8 | -21.1 | -32.0 | -35.5 | -42.8 | -24.0 | -25.5 |
| 2.4 | -21.2 | -21.4 | -29.5 | -38.3 | -45.1 | -24.8 | -25.3 |
| 2.8 | -21.1 | -21.5 | -29.4 | -40.6 | -47.8 | -25.1 | -25.7 |
- PLOTS

- DATE 08-02-2006 Evening Session
Experiment 2: Power Measurement with a Power Meter and Power Sensor.
Objective: We want to use a power meter to measure a reference signal produced by a signal generator.
Equipment Required: - a signal generator - a power meter - an end-line power sensor - a couple of cables for interconnection
Procedure:
- Before starting the experiment, we took care that overloading a device like the power meter may lead to damages or injury. we estimated the power we are going to apply to the device before connecting it and be sure it fits in the accepted range. we adopted a safe setting.
1) we set the signal generator to output a carrier signal with a value of 0 dBm of average power and a frequency of 2.4 GHz?. Disable any modulation. We disabled the output of the generator (RF OFF).
2)We Connected the power sensor to the power meter following its instructions before switching it on. Followed the calibration procedure for the power meter, as indicated in its manual.Used the internally generated reference signal to calibrate the gain of the sensor. After the calibration, the instrument should not be switched off. Exited from the calibration mode of the power meter.
we made sure that this estimated value fits in the actual measurement range of the power meter, setting the range knob.

- Experiment 6
Measurement of cable loss with Spectrum Analyser and Tracking Generator
OBJECTIVE:
To measure the loss of a cable in a continuous range of frequencies by using the Spectrum ANalyzer? with its own Tracking Generator .
Equipment Required: - a tracking generator which can be internal to the Spectrum Analyzer or an external accessory - a Spectrum Analyzer - the cable under measurement - an interconnection cable - connectors/gender adapters if required
Procedure:Before starting the experiment we got ourselves familiar with the spectrum analyzer having a tracking generator. We had similar experience in our last experiment but here we are using the TRACKING GENERATOR instead of SIGNAL GENERATOR. We initialy performed the calibration of the tracking generator. Now
\\||! Cable# ||! Attenuation [dB ] ||! Length [m] ||! Attenuation per meter [dB/meter ] ||
| A | 0.47 | 1.04 | 0.45 |
| B | 8.20 | 1.03 | 7.96 |
| C | 17.45 | 34.85 | 0.5 |
| D | 24.4 | 19.16 | 1.27 |
| E | 3.65 | 3.3 | 1.10 |
| F | 3.92 | 3.9 | 1.01 |
Observations:
| Freq(GHz?) | Ref | A | B | C | D | E | F |
|---|---|---|---|---|---|---|---|
| 1.2 | 20.0 | -31.5 | -39.42 | -41.45 | -46.5 | -33.45 | -34.35 |
| 1.6 | 20.0 | -31.1 | -37.92 | -43.2 | -49.1- | 33.5 | -34.42 |
| 1.8 | 20. | -31.7 | -39.9 | -45.07 | -51.51 | -34.37 | -34.55 |
| 2.0 | 20.0 | -31.1 | -37.77 | -45.62 | -53.33 | -34.1 | -34.9 |
| 2.4 | 20.0 | -31.7 | -36.1 | -48.45 | -55.1 | -35.1 | -35.42 |